

In July 2025, buyer activity in Gunnison County picked up, with 55 properties going under contract—a 12% increase compared to the same time last year. While the number of active listings remained steady month-over-month, it marked a 9% rise year-over-year. Homes spent an average of 103 days on the MLS, reflecting an 8% decrease in market time from July 2024.
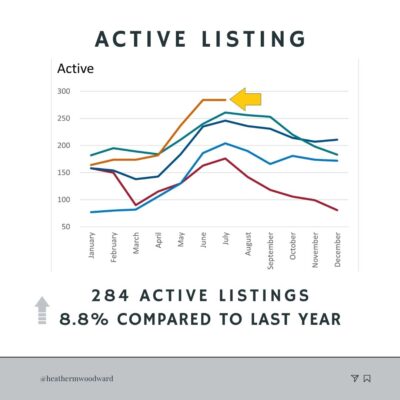
Supply – Active Listings
The number of active listings remained unchanged from the previous month but rose 8.8% compared to the 261 listings available at this time last year.
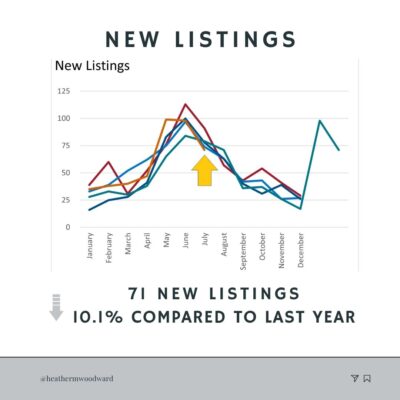
New Listings
New listings dropped 27.6% from June to July. Year-over-year, new inventory was also down by 10.1%, with 71 new listings this year compared to 79 in July 2024.
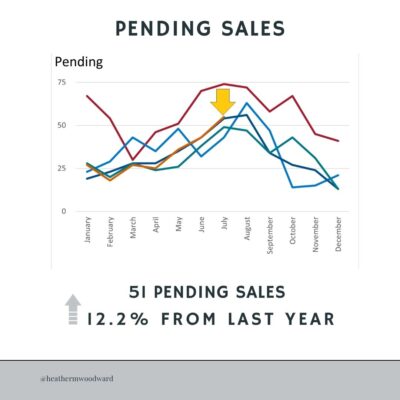
Demand – Pending Sales
Pending sales jumped 27.9% from the prior month, increasing from 43 to 55. Compared to last year’s 49 pending sales in July, this also marks a healthy rise in buyer demand.
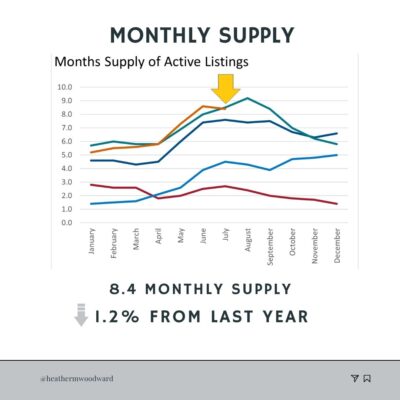
Months Supply of Inventory
The months of supply dipped slightly to 8.4, a 2.3% decline from June. This is also down from the 8.5 months reported in July 2024.
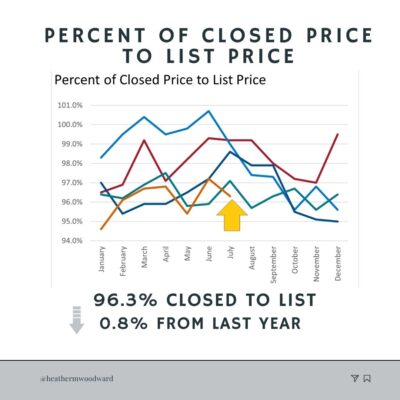
Sale-to-List Price Ratio
Sellers received slightly less in July, with the sale-to-list price ratio falling 0.9% month-over-month. Compared to last year’s 97.1%, this year’s numbers reflect a modest softening in negotiation power.

Let’s chat! Whether you’re looking for market insights, a dream home, or the perfect investment, I’m here to help. Call, text, or email me anytime!
